This guide outlines the essential steps for diagnosing and resolving common voice call issues, such as one-way audio, robotic or choppy sound quality, and total call failures.
When troubleshooting voice over the air, success often comes down to meeting the strict environmental requirements that real-time protocols demand. Before diving into the logs on your controller, keep these three industry standards in mind:
The Golden Rules of Voice Traffic
Packet Loss (<1%): Specifically for the G.729 codec, audible artifacts and dropped syllables occur if packet loss exceeds 1%. Voice is unforgiving; there is no “retransmission” for a lost syllable.
One-Way Latency (<150ms): Per the ITU G.114 specification, high-quality real-time traffic requires an end-to-end delay of less than 150ms. Beyond this threshold, conversations become “walkie-talkie” style, with users constantly talking over one another.
QoS Alignment: Proper prioritization is mandatory. You must ensure consistent mapping between Layer 2 User Priority (UP) and Layer 3 DSCP values to keep voice traffic at the front of the queue.
The UDP Reality: Unlike the TCP flows we’ve analyzed previously, voice traffic relies on UDP. Because UDP doesn’t use acknowledgments, it is hypersensitive to jitter and out-of-order delivery. If the network doesn’t treat this traffic with high priority, the audio quality will degrade instantly.
Phase 1: Optimizing QoS and Disabling Legacy Constraints
Before troubleshooting the packets, you must ensure the wireless infrastructure isn’t “over-managing” the traffic. In many cases, features designed to help—like Call Admission Control (CAC) and AutoQoS—can actually be the primary cause of audio degradation.
The Pitfalls of Voice AutoQoS and TSpec
In the Catalyst 9800, enabling Voice AutoQoS is often a trap. When enabled on a single SSID, it frequently triggers Admission Control (ACM/CAC) globally.
Why is this a problem? It forces the use of TSpec, a legacy protocol where each client must negotiate specific bandwidth with the AP. If a client requests less bandwidth than it truly needs, the AP will throttle it, causing choppy audio. In the era of high-capacity Wi-Fi (WMM, TXOP, and AIFSN), TSpec is often buggy and unnecessary. The goal is to prioritize the traffic via QoS, not restrict it via TSpec.
Configuration Guide: Disabling CAC and Enabling WMM
To get the best results, you should disable CAC (ACM) and SIP CAC, ensuring the “pipes” are open for prioritized traffic.
For Catalyst 9800:
Disable AutoQoS: Navigate to
Configuration > Tags & Profiles > Policy > [Policy Name] > QoS and AVC. Disable AutoQoS and ensure the QoS SSID Policy is set to Platinum with Platinum-up.Disable SIP Snooping: Under the same page, disable SIP-CAC.
Ensure WMM is Allowed: Under
Configuration > Tags & Profiles > WLANs > [SSID] > Advanced, verify that WMM is set to Allowed.Global ACM Disable: This requires a brief radio reset:
Go to
Configuration > Radio Configurations > Network, uncheck 5 GHz Network Status, and hit Apply.Navigate to
Media Parametersand turn off Admission Control (ACM) for both Voice and Media.Return to the Network page, re-enable the 5 GHz Network Status, and hit Apply.
Phase 2: Deep Dive Debugging for the Phone Session
If optimizing your QoS settings didn’t solve the issue, it’s time to look under the hood. When a phone is in a RUN state but still can’t make a call, or the audio remains unusable, we need to capture the exact signaling and data flow.
Here is how to run a surgical debug on both platforms.
Step 1: Foundational Show Commands
Start by gathering the client’s current state:
terminal length 0
show tech wireless
show wireless client mac-address <client_mac> detail
Step 2: Radioactive (RA) Tracing
This is the gold standard for 9800 debugging. It tracks the specific MAC address across all processes.
Start the trace:
debug wireless mac <client_mac> monitor-time <seconds>Note: Always set the timer longer than your test—adding an extra hour ensures the trace doesn’t cut off mid-call.
Reproduce the issue and then stop the trace:
no debug wireless mac <client_mac>Collect the log: The file is generated in bootflash as
debugTrace_<client-mac>.txt. You can download this via the GUI underAdministration > Management > File Manager.
Step 3: Embedded Packet Capture (EPC)
If traffic is centralized, use EPC on the WLC. If it’s FlexConnect Local Switched, run this on the AP switchport:
monitor capture MYCAP interface <int> both
monitor capture MYCAP buffer size 100
monitor capture MYCAP match any
monitor capture MYCAP inner mac <client_mac>
monitor capture MYCAP start

# Reproduce the issue

monitor capture MYCAP stop
The AP Switchport: Capturing the “Wire” Side
Regardless of your controller, sometimes you need to see what the AP is sending to the rest of the network. If the client is using FlexConnect Local Switching, the WLC won’t see the data—only the switch will.
Option A: EPC (On Catalyst 4500/9k Switches)
If your switch runs IOS-XE, use the same EPC logic as the 9800:
monitor capture TAC interface <AP-port> both match any buffer size 100monitor capture TAC start-> Reproduce ->monitor capture TAC stopExport the file:
monitor capture TAC export <location>
Option B: SPAN (The Old School Method)
If you are on legacy hardware like a 3650/3750X, a SPAN session is your best bet to pipe data to a laptop running Wireshark:
Identify the Source: The port connected to the Access Point.
switch(config)# monitor session 1 source interface gi1/1Assign the Destination: The port where your laptop (running Wireshark) is connected.
switch(config)# monitor session 1 destination interface gi1/2 encapsulation dot1qVerification: Confirm the session status.
switch# show monitor session all
Why use
encapsulation dot1q? This is critical for voice troubleshooting. It ensures that the VLAN tags and associated Layer 2 CoS/QoS markings are preserved in your capture, allowing you to verify that your voice traffic is being prioritized correctly as it leaves the AP.
Phase 3: Making Sense of the Data
Once you have your RA traces and packet captures, the focus shifts from collection to interpretation. We need to verify the client’s health on the controller and examine the signaling path on the wire.
1. Assessing Client State and Connectivity
Before looking at the audio, confirm the client’s fundamental “health” in the WLC/AP logs:
RSS/SNR Metrics: Check the RA trace—is the client in a stable RUN state? If the signal-to-noise ratio is poor, the audio will be the first thing to suffer.
ACLs and Policies: Are there any Access Control Lists applied to the session? For testing, remove them to see if the call failure persists.
AAA & VLANs: Ensure the client is landing in the correct VLAN and that AAA isn’t overriding settings dynamically in a way that breaks the voice path.
Note: If the client fails to reach the RUN state due to Dot1x issues, refer to my “Mastering 802.1X Flow” & “Dot1x Troubleshooting Guide” posts for a TAC-level breakdown.
2. Analyzing the SIP Signaling Path
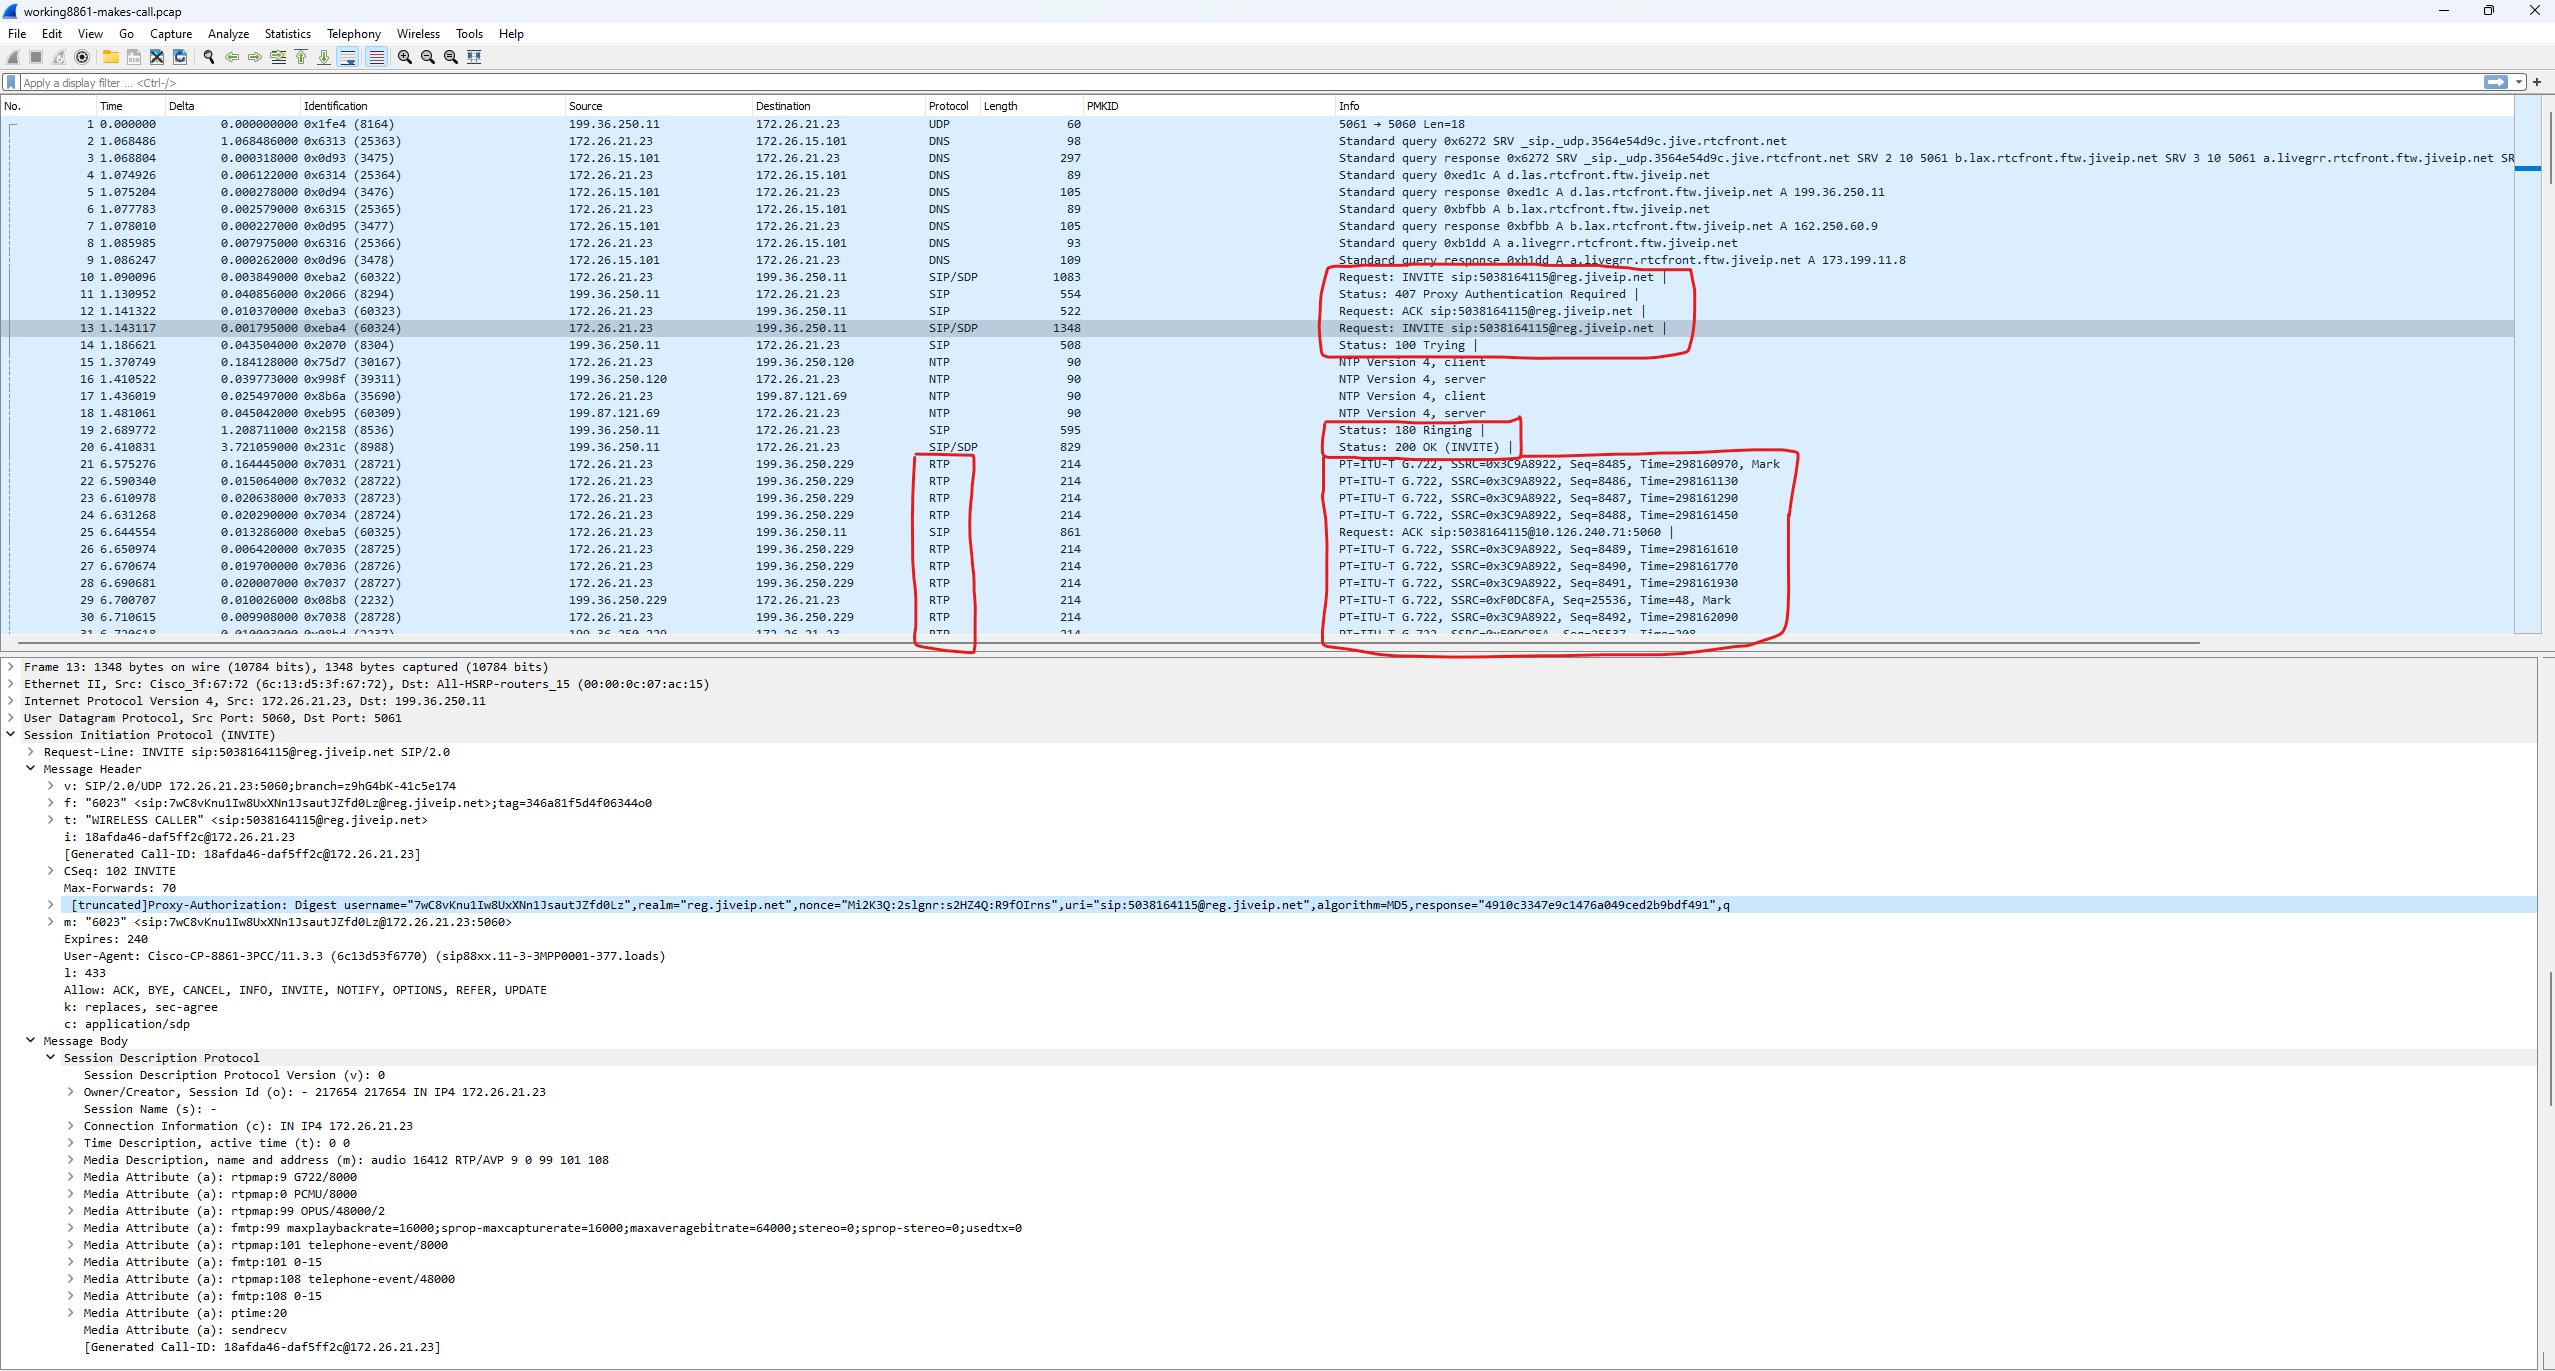
Examine the AP switchport capture for the “handshake.” A successful call setup should follow a clear pattern:
DNS: Is the call manager’s name being resolved?
SIP Flow: You should see a clear sequence of
Request: Invite->Status: 100 Trying->Status: 180 Ringing->Status: 200 OK.RTP Handover: Does the RTP data stream actually begin immediately after the SIP handshake?
3. Inspecting the RTP Stream (Audio Quality)
If the signaling is correct but the audio is poor, use Wireshark’s built-in telephony tools. Navigate to Telephony > RTP > RTP Streams.
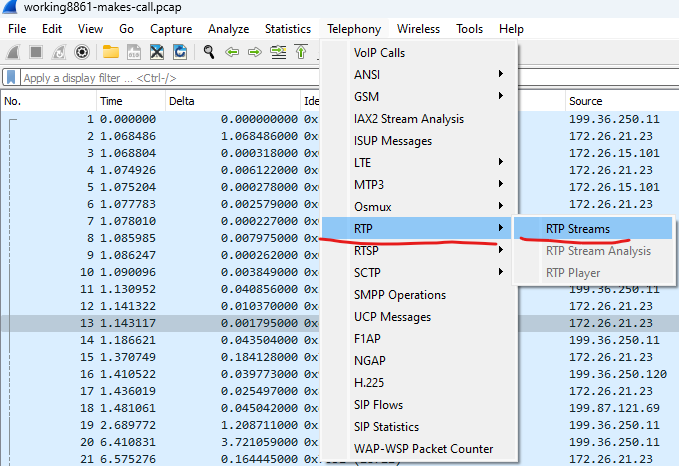
Bidirectional Flow: You should see two streams (client-to-server and server-to-client). Analyze both.

Key Metrics: Look for Jitter and Lost Packets. High jitter (>30ms) or any packet loss will cause the “robotic” audio symptoms users complain about.
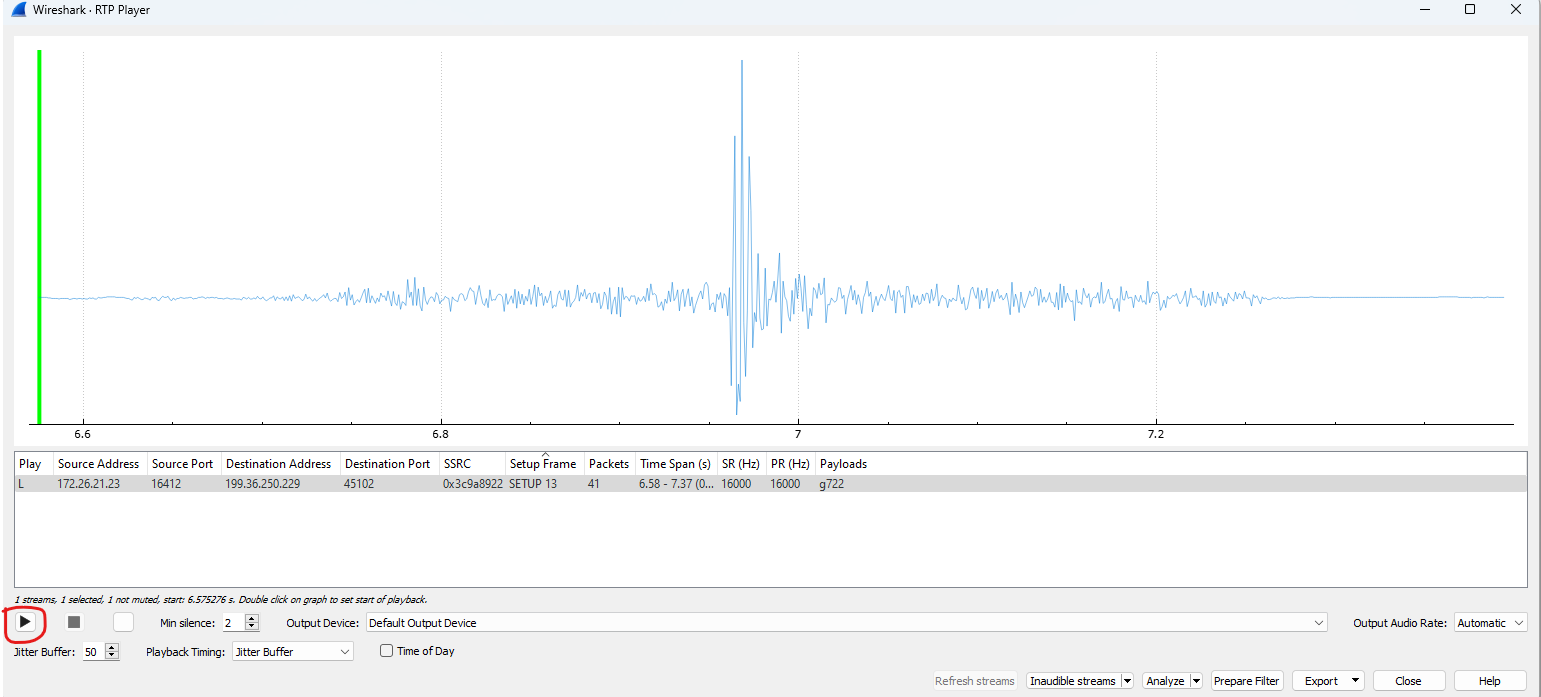
Audio Playback: You can select a stream and click Play Streams. This allows you to actually hear the audio quality. If the audio is clear here but the user hears static, the issue might be the physical handset or local interference.
Phase 4: Systematic Review of RTP Streams
Once you have your captures, the final step is a meticulous review of the data. A high-quality call is a two-way street; for a call to be successful, the RTP streams in both directions must be healthy.
1. Identifying the Traffic Flow
Before diving into the metrics, you must clearly identify the participants in the stream to avoid going down the wrong troubleshooting route:
Verify the Client IP: Confirm the IP address assigned to the wireless client connected to the AP.
Identify the Destination: Confirm the IP address on the other end (the gateway, PBX, or another handset).
Watch the Directions: Always double-check which stream you are examining (Upstream vs. Downstream). Misinterpreting the direction can lead you to believe the wireless environment is the problem when the issue is actually occurring on the wired side.
2. Isolate the Bottleneck via the AP Switchport
The AP Switchport capture remains your primary source of truth for isolating the wired vs. wireless segments:
If the stream is clean [Client → Wired]: If there is no packet loss and minimal jitter at the switchport, the wireless medium is healthy. Coordinate with a voice engineer to perform a matching capture near the destination device to see if traffic is being damaged further down the wired path.
If the stream is damaged [Client → Wired]: If jitter or loss is present at the switchport, the issue is occurring between the client and the AP. It is time to move to an Over-the-Air (OTA) capture to investigate RF interference or contention.
3. The OTA Capture Challenge: Encryption Matters
Capturing voice “over the air” provides deep insight into the RF environment, but encryption often gets in the way:
Dot1x (Enterprise) SSIDs: These are notoriously difficult to decrypt. Without capturing the original 4-way handshake and possessing the PMK (eap-msk) hash, the RTP payload will remain unreadable. In busy environments, missing the initial handshake is a common pitfall.
The “Easy Decryption” Strategy: For faster troubleshooting, temporarily move the test device to a PSK (Pre-Shared Key) or Open SSID with same Vlan ID configuration. This guarantees you can capture the handshake and allows Wireshark to decrypt the audio data effortlessly.
Conclusion: Trust the Process
By systematically reviewing one stream, closing it, and then opening the reverse path, you can definitively prove where the audio is compromised. This methodical approach ensures you aren’t just guessing, but are instead providing a data-driven diagnosis of whether the fault lies with the network “pipes” or the client device itself.